
Navigation: WP Admin > License Server > Dashboard
The dashboard gives you a real-time pulse of your software business. Rather than digging through orders, licenses, and subscriptions individually, the dashboard surfaces the numbers that matter most — revenue trends, license health, and product performance — so you can make informed decisions at a glance.
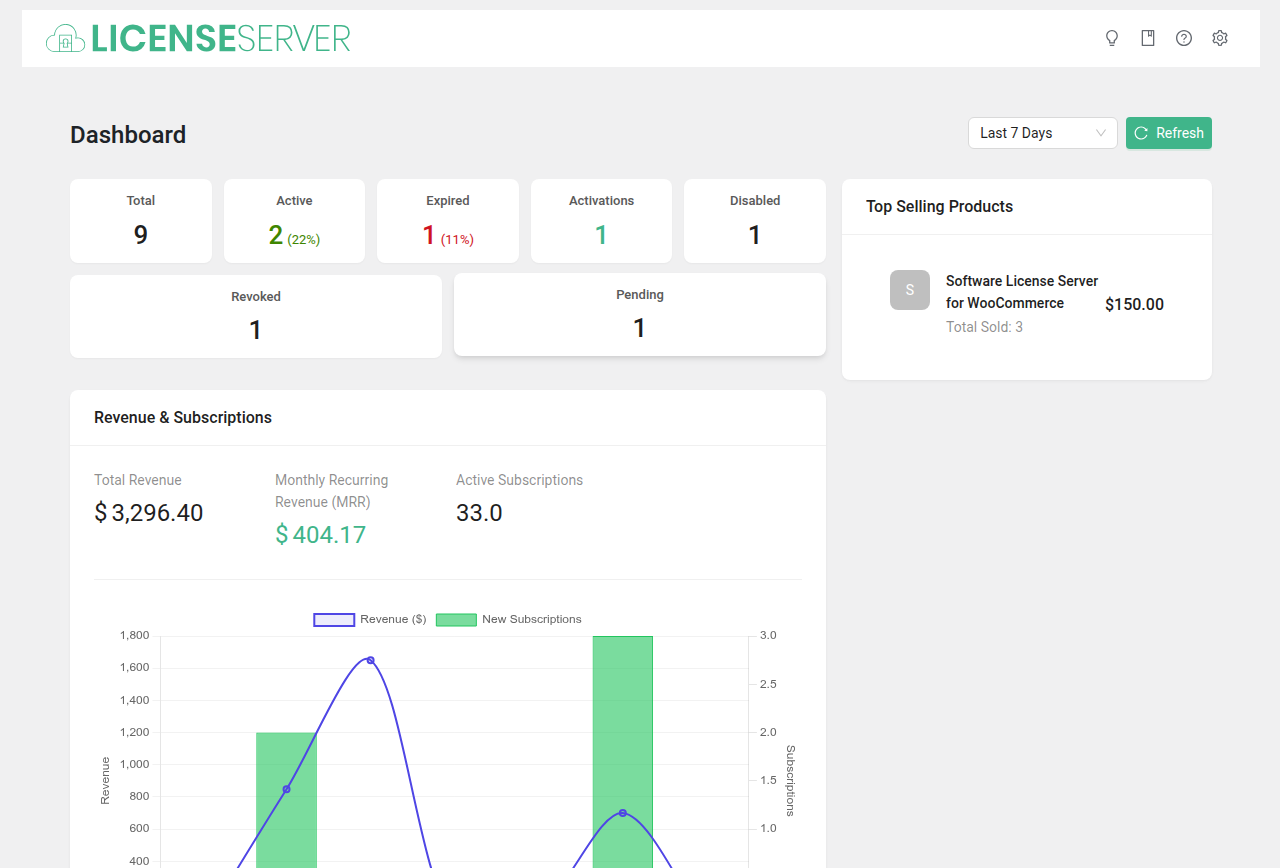
Overview Stats
The top of the dashboard displays four summary cards with key metrics:
- Total Licenses — The total number of licenses issued across all products. This reflects your cumulative customer base size. If this number grows steadily, your acquisition funnel is healthy.
- Active Licenses — Licenses currently in use on at least one domain. Compare this to Total Licenses — a large gap suggests customers are purchasing but not deploying your software. Investigate onboarding friction or consider sending activation reminder emails.
- Total Revenue — Cumulative revenue from license sales within the selected date range. This is your top-line number. Watch for month-over-month growth or contraction.
- Active Subscriptions — Currently active recurring subscriptions. This is your recurring revenue base. A declining number means churn is outpacing new sign-ups.
Tip: If Active Licenses is significantly lower than Total Licenses, check the Reports page for your Activation Rate metric. A low activation rate often points to onboarding problems rather than product issues.
Revenue Charts
A revenue chart visualizes sales over time. Use the date range filter to narrow the view to a specific period (e.g., last 7 days, last 30 days, this year, or a custom range).
The chart helps you spot trends that raw numbers can hide:
- Spikes may correspond to promotions, launches, or seasonal demand.
- Dips can indicate payment failures, pricing issues, or increased churn.
- Plateaus suggest your growth has stalled and it may be time to invest in marketing or new features.
Top Products
A ranked list of your best-selling software products by revenue. Use this to:
- Identify which products drive the most income and deserve the most development investment.
- Spot underperforming products that may need better marketing, pricing adjustments, or feature improvements.
- Decide which products to prioritize for updates, documentation, or support resources.
Date Range Filter
All dashboard widgets respond to the date range selector at the top of the page. Select a preset range or define custom start and end dates to focus on a specific reporting period.
Tip: Compare the same period across different time frames (e.g., this month vs. last month) to identify growth or decline trends.
Understanding the Metrics
Total Licenses vs. Active Licenses
The gap between these two numbers tells a story:
| Scenario | What It Means | Action |
|---|---|---|
| Active is close to Total | Most customers are using your software. Healthy adoption. | Keep doing what you are doing. |
| Large gap, many inactive | Customers bought but never installed. Possible onboarding issue. | Improve welcome emails, installation docs, or offer setup assistance. |
| Large gap, many expired | Customers are not renewing. Possible value or pricing issue. | Check churn rate in Reports. Review your renewal email strategy. |
Active Subscriptions Trend
Watch the Active Subscriptions count over time:
- Growing month over month: Your business is healthy. New subscriptions outpace cancellations.
- Flat: You are acquiring new customers at roughly the same rate you are losing them. Focus on reducing churn.
- Declining: Churn is winning. Investigate failed payments, customer complaints, and whether your product is keeping up with the market.
Reading Your Dashboard
The dashboard is most valuable when you use it as a starting point for deeper investigation:
- Revenue declining? Head to Reports to check your churn rate and refund rate. Then review Subscriptions to see if failed payments or cancellations are increasing.
- Active licenses dropping? Check the Licenses page and filter by "expired" status. If many licenses expired recently, your renewal emails may not be reaching customers — review your Email Notifications settings.
- Top product shifting? If a previously dominant product is losing ground, check its subscription renewal rates and customer support ticket volume on the Support page.
- Everything looks healthy? Use this time to review Reports for your VIP customers and consider reaching out with personalized offers or early access to new features.
Weekly Dashboard Review
For a quick health check, spend 5 minutes on the dashboard each week:
- Check the revenue chart for the past 7 days. Compare to the previous 7 days. Any significant changes?
- Glance at Active Subscriptions. Is the number going up or down?
- Check the Active vs. Total license ratio. If the gap is widening, investigate.
- Review Top Products. Any surprises in the ranking?
- If anything looks off, drill into Reports or Logs for the details.
Tip: Make the dashboard your browser's first tab when you start your workday. A quick glance catches problems before they become emergencies.
Related Pages
- Reports — Detailed business intelligence metrics
- Licenses — Manage individual license keys
- Subscriptions — Manage recurring billing