
Navigation: WP Admin > License Server > Reports
The Reports screen provides business intelligence metrics to help you understand revenue, customer behavior, and product performance. While the Dashboard gives you a quick snapshot, Reports dives deeper into the health of your software business and surfaces trends that require action.
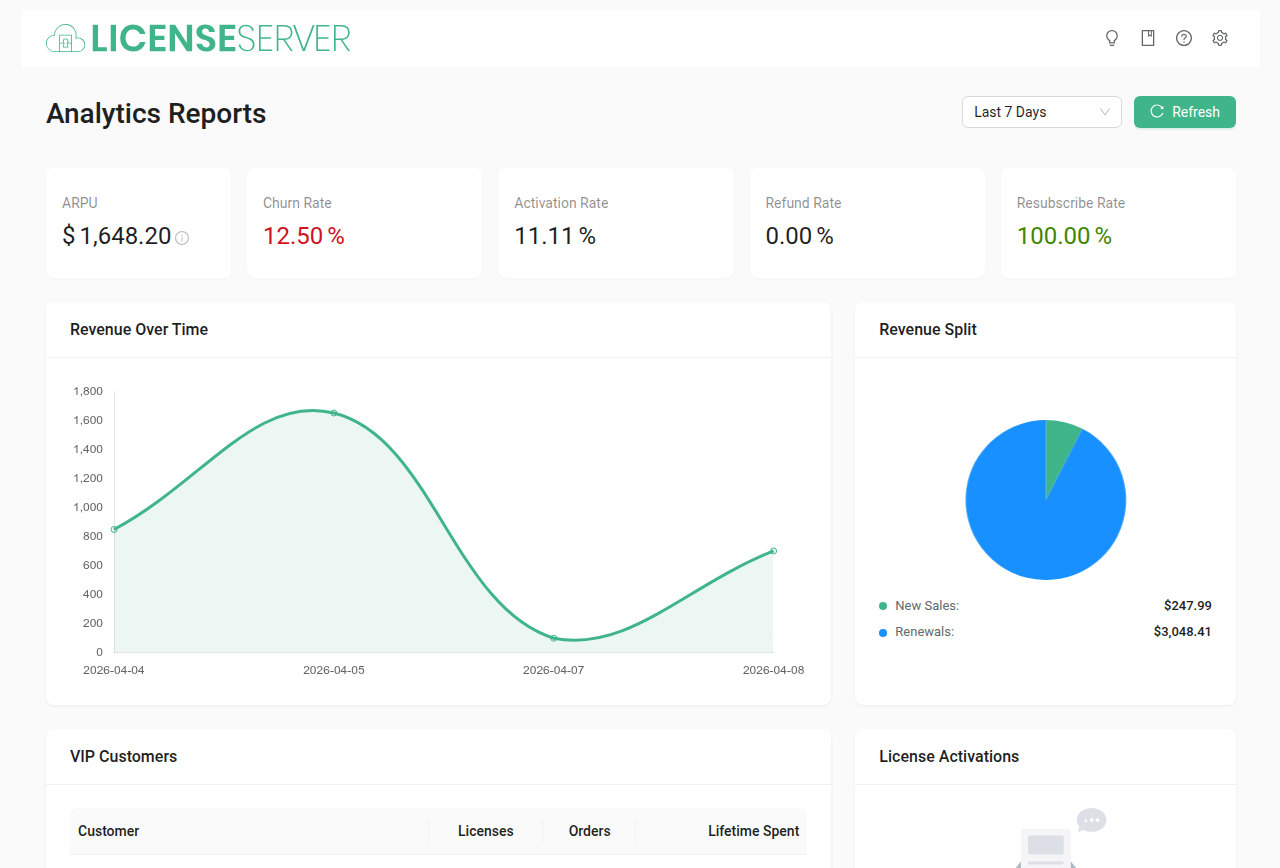
Available Metrics
ARPU (Average Revenue Per User)
The average revenue generated per paying customer over a given period. This metric tells you how much each customer is worth to your business.
How to interpret:
- A rising ARPU means your upsells, pricing changes, or premium tiers are working.
- A declining ARPU may indicate you are attracting more low-tier customers or offering too many discounts.
- Benchmark: ARPU varies widely by market segment. For developer tools and WordPress plugins, an ARPU of $50–$200/year is common. Compare against your own historical trend rather than industry averages.
Tip: To increase ARPU, consider introducing higher-tier plans with more activation slots, priority support, or additional features.
Churn Rate
The percentage of customers whose subscriptions expired or were canceled during the reporting period. Churn is the single most important metric for a subscription-based software business — it determines whether you are growing or shrinking.
How to interpret:
- Healthy churn: Under 5% monthly (or under 10% annually) is considered healthy for most software businesses.
- Elevated churn (5–10% monthly): Investigate whether this is voluntary (customers canceling) or involuntary (failed payments). Check your Subscriptions page for on-hold subscriptions.
- High churn (over 10% monthly): This is a red flag. Review customer support tickets for recurring complaints, check your refund rate, and consider whether your pricing matches the value delivered.
Activation Rate
The percentage of issued licenses that have been activated on at least one domain. This measures how effectively customers are adopting your software after purchase.
How to interpret:
- Above 80%: Excellent. Most customers are successfully deploying your software.
- 60–80%: Acceptable, but there is room to improve your onboarding flow, installation instructions, or welcome emails.
- Below 60%: Investigate urgently. Customers are paying but not using your software, which leads to churn. Common causes include confusing installation steps, technical requirements customers cannot meet, or a gap between marketing promises and actual functionality.
Refund Rate
The percentage of orders that have been refunded. This helps identify product quality or expectation mismatch issues.
How to interpret:
- Below 2%: Healthy. Some refunds are inevitable.
- 2–5%: Worth monitoring. Check if refunds cluster around specific products or customer segments.
- Above 5%: Investigate immediately. Common causes include misleading product descriptions, critical bugs in recent releases, compatibility issues, or customers who cannot get the software working.
Warning: A sudden spike in refund rate after a product update often indicates a regression. Check the Logs for error patterns.
Revenue Split
A breakdown of revenue showing the balance between new sales and renewal revenue. This chart reveals the sustainability of your business.
How to interpret:
- Healthy balance: Renewals should make up 60–80% of total revenue for a mature product. This means your existing customer base is stable.
- Mostly new revenue: If new sales dominate, your business depends on constantly finding new customers. Focus on reducing churn to build a stable recurring base.
- Mostly renewal revenue: Your existing customers are loyal, but new customer acquisition may be stalling. Invest in marketing and outreach.
The revenue split by product shows which software products contribute most to your total income, helping you prioritize development and marketing efforts.
VIP Customers
Your highest-value customers ranked by total lifetime spend. These customers are the backbone of your business.
What to do with this information:
- Personalized outreach: Send VIP customers early access to new features or beta releases.
- Premium support: Consider offering dedicated support channels or faster response times.
- Feedback source: VIP customers have the deepest experience with your products. Reach out for product feedback and feature requests.
- Retention priority: If a VIP customer's subscription is about to expire or they have filed support tickets, prioritize their needs.
Monthly Review Checklist
Use this checklist to stay on top of your business health:
- Check churn rate — Is it trending up or down compared to last month?
- Review ARPU — Has pricing or plan mix changed?
- Check activation rate — Are new customers successfully deploying?
- Review refund rate — Any sudden spikes after product updates?
- Check revenue split — Is the new vs. renewal balance healthy?
- Review VIP customers — Are your top customers still active and happy?
- Cross-reference with Dashboard — Do the high-level numbers align with what Reports is telling you?
Related Pages
- Dashboard — High-level overview and revenue charts
- Subscriptions — Manage recurring billing and investigate churn
- Licenses — Review activation patterns